In France, photo and photos both report exactly 246,000 monthly
searches in Google Keyword Planner. Not approximately. Identically.
That is not a rounding artefact. It is the single most consequential fact about keyword volume data, and almost nobody who buys it knows it.
How accurate is Google Keyword Planner search volume?
We hold a calibrated demand corpus of 106,313 distinct keywords across eight European markets, built by co-measuring Google Ads volumes against Google Trends and Google Search Console. That corpus lets us do something the tool vendors don't: measure the measuring instrument. The short answer: directionally useful, numerically distorted — in four specific, measurable ways. Each challenge follows with the evidence, and then the method that gets past them.
Challenge 1 — close variants: one number for many keywords
Google documents that Keyword Planner reports data for "keywords and their close variants". What isn't obvious is the scale, or what it does to your numbers.
We took every singular/plural pair in the corpus carrying a raw Keyword Planner figure — 4,678 pairs — and compared them. 1,217 (26.0%) are byte-identical.
| market | singular | plural | reported volume |
|---|---|---|---|
| fr | photo | photos | 246,000 / 246,000 |
| be | calculatrice | calculatrices | 165,000 / 165,000 |
| fr | scanner | scanners | 110,000 / 110,000 |
| es | camara | camaras | 74,000 / 74,000 |
| nl | camera | cameras | 49,500 / 49,500 |
The variants are not being measured separately and coincidentally agreeing. They are being served the same family total. Sum a keyword list built this way and you double-count — every "total addressable search demand" figure assembled by addition is inflated, unevenly, by however many variants of the same idea made the list.
Limit, stated plainly: this tests only the +s case, so 26% is a lower
bound.
Watch it happen live. On 28 July 2026 we asked the Google Ads API for UK volumes on three terms — the singular, the plural, and a misspelling:
| term | Google Ads (live probe) | Google Trends (5-yr avg interest) | Theia calibrated estimate |
|---|---|---|---|
| camera | 165,000 | 75 | 45,251/mo |
| cameras | 165,000 | 14 | 9,316/mo |
| camwra | 165,000 | 0 | — |
One bucket, three demand realities — and the bucket is the family's combined total, served to every member. Add the three "keywords" to size a market and you have just tripled it. (It is not that any string gets a number: pure gibberish returns nothing. Google recognises the misspelling as part of the camera family and hands it the family total — recognition, not measurement.) Google Trends — which measures exact strings — shows the plural carrying roughly a fifth of the singular's interest, and the typo carrying none:
The apportioning itself is simple arithmetic: weight the family total by Trends' exact-string interest (75 : 14 : 0) and the 165,000 splits into camera ≈ 139,000 · cameras ≈ 26,000 · camwra 0 — same total, honest shares. Our production estimates in the table sit lower still (45,251 / 9,316) because the family bucket itself is overstated — that correction comes from calibrating against measured impressions, and the gap between Google Ads and Search Console is a story of its own, covered in a companion article in this series.
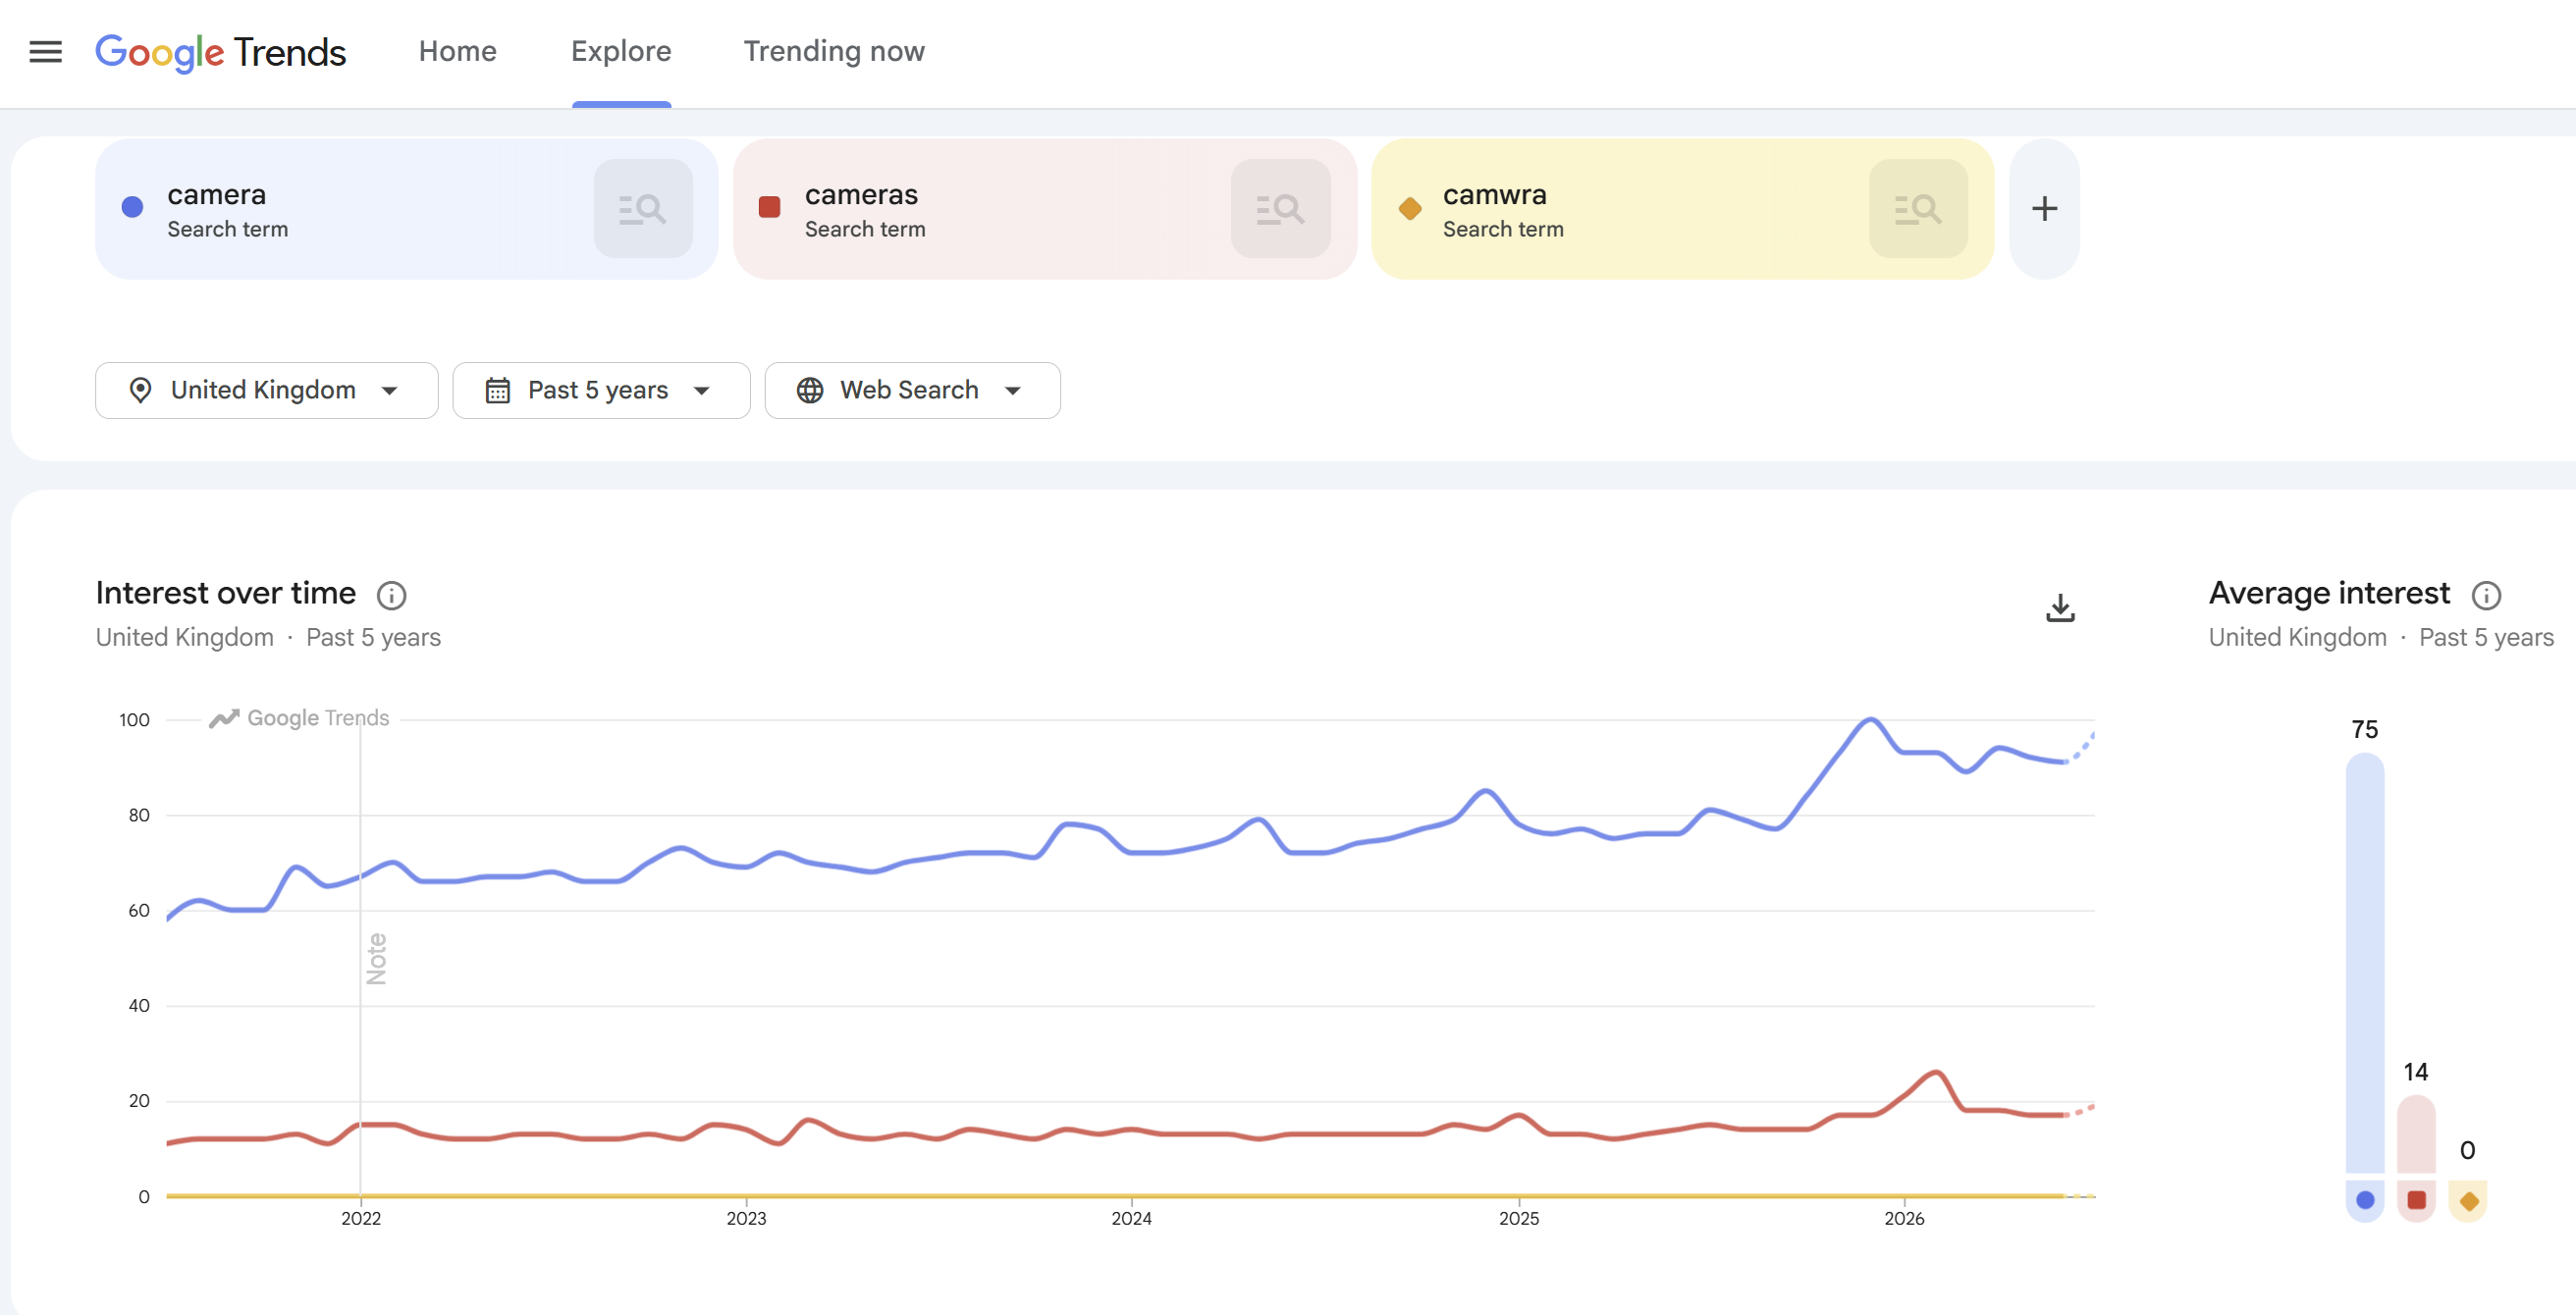 The same three terms Google Ads prices identically at 165,000. Google
Trends, UK, past 5 years: camera 75 · cameras 14 · camwra 0.
The same three terms Google Ads prices identically at 165,000. Google
Trends, UK, past 5 years: camera 75 · cameras 14 · camwra 0.
Challenge 2 — misspellings inherit the family's total
Once you know families are merged, the misspellings stop being mysterious.
camwra above is not an outlier:
| market | misspelling | reported volume | intended term |
|---|---|---|---|
| de | druckee | 202,976 | Drucker |
| de | deucker | 78,708 | Drucker |
| fr | ilprimante | 168,176 | imprimante |
| fr | appareille photo | 65,048 | appareil photo |
Source: our calibrated corpus (BigQuery keyword_search_volume, measured
2026-07-23) — top misspellings by reported volume per market.
Nobody searches "ilprimante" 168,176 times a month. The misspelling inherits
the correctly-spelled family's total — Challenge 1 wearing a different hat.
Any keyword list built by pulling "high-volume related terms" hoovers these
up and treats them as real demand; a demand model that can't tell camwra
from camera will happily brief content against a typo.
Challenge 3 — the keywords Google won't price at all
Some keywords return nothing — not zero, nothing. Two documented policy families explain most of what we see, and both are measurable.
Cryptocurrency. In our German corpus, 330 distinct keywords containing
eos — Canon's flagship camera line — carry zero Google Ads rows,
while Trends and Search Console show real demand (eos r50 ≈ 1,184/mo,
eos r8 ≈ 772/mo). EOS is also a cryptocurrency, and Google treats
crypto as a restricted financial category: its ads policy allows
crypto-related promotion only "in limited
circumstances", with
certification requirements by jurisdiction. The camera keywords appear to be
collateral damage of a token-level financial restriction — priced at
nothing because the string matches a coin.
Children's products. Google's personalized-advertising policy states that "users under the age of 18 are not eligible for personalized advertising of any kind". Consistent with that, we probed the Australian car-seat family live on 28 July 2026:
| term | Google Ads (live probe) | Google Trends (5-yr avg interest) |
|---|---|---|
| car seats | 18,100 | 61 |
| baby car seat | 12,100 | 55 |
| newborn car seat | 2,900 | 5 |
| child car seat | nothing returned | 14 |
| pram (control) | 22,200 | — |
| office chair (control) | 60,500 | — |
The suppression is term-level, not category-level: "baby" and "newborn" phrasings price normally; the one phrased with "child" — carrying roughly a quarter of the head term's Trends interest (average 14 vs 61), real and continuous — returns nothing at all.
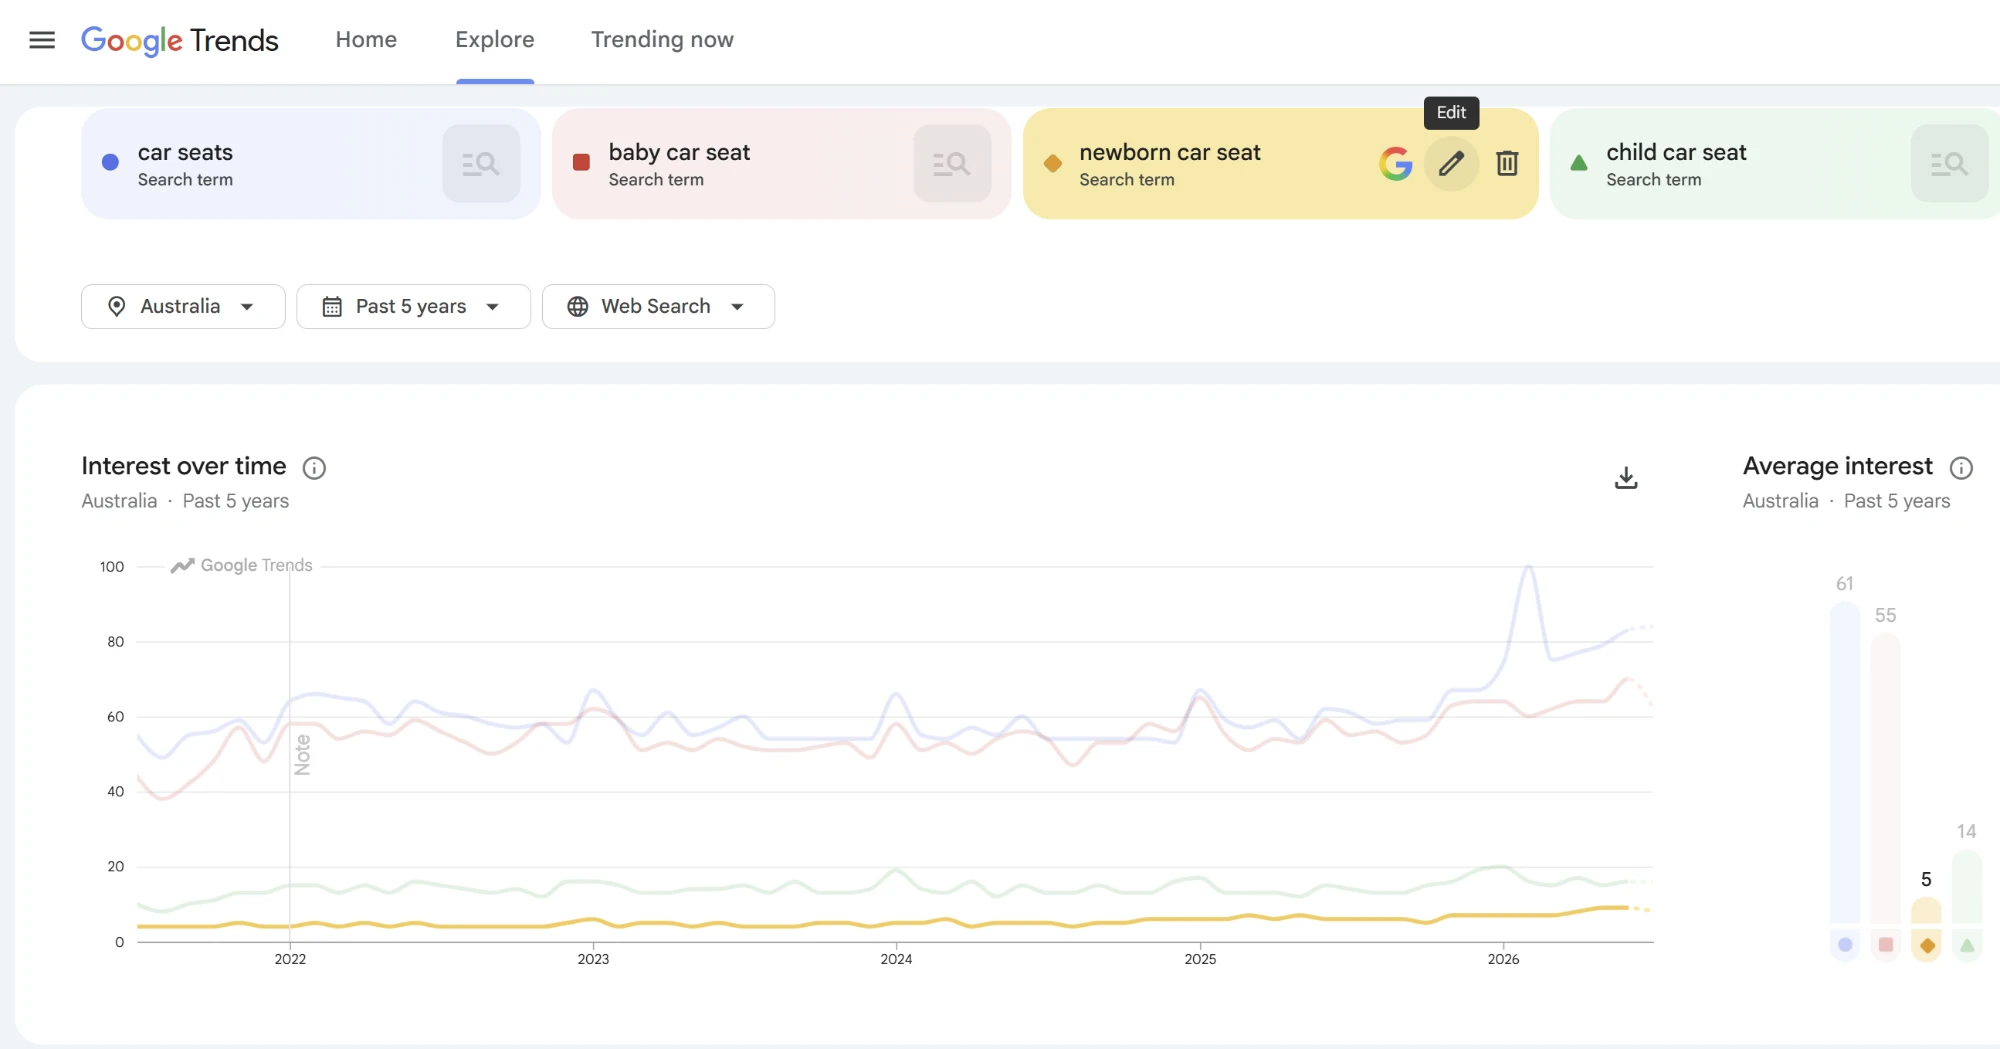 All four terms are visibly searched (Trends, AU, past 5 years). Google Ads
prices three of them — and refuses the one containing "child".
All four terms are visibly searched (Trends, AU, past 5 years). Google Ads
prices three of them — and refuses the one containing "child".
An Ads blank is not evidence of no demand. The discipline that follows: measure the missing keyword — from Trends' relative interest and Search Console's measured impressions — rather than letting a policy filter delete real demand from your market model.
Challenge 4 — the numbers are quantised, not measured
Look again at the volumes in Challenge 1: 49,500 · 74,000 · 110,000 · 165,000 · 246,000. The same values recur across unrelated keywords in unrelated countries.
Across the 101,897 keywords in our corpus that carry a raw Keyword Planner figure, only 1,462 distinct values occur. We make no claim about a fixed global ladder — only the measured observation: seventy keywords share every value on average. A keyword reported at 49,500 is not "49,500 searches"; it is "somewhere in the bucket labelled 49,500". Two keywords sharing a bucket can differ materially in real demand, and a keyword that jumps a bucket has not necessarily changed at all — which is why month-on-month "growth" read off Keyword Planner is so often noise.
How we get to a number you can trust
Our demand estimates are never raw Keyword Planner figures, and never third-party volume APIs that resell them. The method:
- Anchor. Group keywords into small co-measurement sets with a known-volume anchor term, so Google Trends' relative index can be scaled to an absolute figure.
- Apportion the family total to each variant. Trends measures exact
strings, so the merged family is split back into its members, each
getting its honest share —
cameraandcamerasget their own numbers (45,251 and 9,316 above), andcamwragets none. Never sum variants; apportion them. - Prefer measured impressions where they exist. Google Search Console reports real impressions for exact queries. Where we have it, it outranks any estimate — including for the keywords Ads refuses to price.
- Keep the series and the spot estimate apart. A twelve-month calibrated series answers "is this growing?"; a nowcast — a recency-weighted estimate of the current month — answers "what is it now?". Conflating them is how stale averages get presented as current demand.
- Re-validate per market, rather than assuming a keyword's market is the market you requested it for.
Does it matter? Across 11,081 keywords where we hold both figures, the calibrated estimate's median is 0.51× the raw Keyword Planner number — the typical keyword's defensible volume is about half what the tool says, which is exactly what Challenge 1 predicts: if a family total is served to every member, every member is overstated.
All of it runs through the API, at scale. That is partly efficiency — thousands of keywords, refreshed on schedule, no manual Keyword Planner exports — but mostly discipline, because the API has teeth. We learned in our own early runs that one malformed keyword errors the entire volume batch it travels in, silently zeroing every valid term beside it; our pipeline now sanitises and isolates so a single bad keyword never poisons a batch. And the API returns the same bucketed, variant-merged, policy-filtered values described above — automation doesn't fix the instrument, measurement does.
The result is auditable: every estimate is persisted beside the raw Ads, Trends and Search Console readings it was derived from, with its source, anchor and scaling factor — so anyone can see how a number was made and disagree with it specifically.
From keywords to clusters: demand per topic
Single-keyword volumes — even honest ones — understate how demand should be read. Phrasings are substitutes: nobody plans content for "car seat" and separately for "car seats". So we group keywords into clusters and estimate traffic potential per cluster. One live example from the Australian car-seat market above — the cluster our engine names forward facing car seat:
| cluster member | calibrated est./mo |
|---|---|
| car seats | 22,583 |
| car seat | 19,187 |
| baby car seat | 12,474 |
| convertible car seat | 5,950 |
| nuna car seat | 5,259 |
| car seat for newborn | 4,568 |
| newborn car seat | 4,440 |
| infant car seat | 4,327 |
| mothers choice car seat | 4,061 |
| big w car seats | 2,945 |
| rear facing car seat | 2,059 |
| forward facing car seat | 1,987 |
Source: our Australian baby-gear study (calibrated estimates, measured 2026-07-28); cluster membership from Theia's keyword clustering.
Read as a cluster, this is one demand pool of ~90K monthly searches with its structure visible: generic head terms, phrasing variants that Ads would double-count, brand entrants (Nuna, Mother's Choice), a retailer (Big W), and intent qualifiers (rear/forward facing). That is the unit a content plan, a category strategy, or a PPC structure should be built on — not 12 separately-mispriced strings.
Why no vendor publishes this
Ahrefs' own documentation describes Google Keyword Planner as the baseline for its volume figures, refined with clickstream data; SEMrush's describes third-party data blended with historical clickstream and machine learning. Either way, the industry's volume figures are modelling layers on top of already-grouped inputs — not independent measurements of demand. That is why vendors' numbers agree with each other more than they agree with reality, and why none of them publishes a study like this one: it would mean auditing their own baseline.
We can publish it because we don't sell the number. We sell the decision that depends on it — and that decision is only as good as an honest instrument.
Where this sits
This page is part of our search-data series, grounded in Market research: what it is, what it's for and The four silos of market research. Companion pages — Amazon search volume (where no official number exists at all), scaling Google Trends to thousands of keywords, and how Ads, Search Console and Trends combine into one estimate — follow in this series.
References
- Google Ads Help — keyword ideas and close variants
- Google Ads policy — financial products and services (cryptocurrency)
- Google Ads policy — personalized advertising and users under 18
- Ahrefs Help — how accurate is keyword search volume in Ahrefs
- Semrush KB — what is search volume in Semrush
Frequently asked
- How accurate is Google Keyword Planner's search volume?
- Directionally useful, numerically distorted. In our 106,313-keyword corpus: 26% of singular/plural pairs report byte-identical volumes (family merging), only 1,462 distinct values occur across 101,897 keywords (bucketing), whole term families return nothing (policy filtering), and the calibrated median sits at 0.51x the raw figure. Treat it as a labelled bucket, not a measurement.
- Why do Ahrefs and SEMrush search volumes differ from each other?
- Ahrefs documents Keyword Planner as the baseline it refines with clickstream; SEMrush documents third-party data blended with clickstream and machine learning. The differences you see are each vendor's modelling layer on already-grouped inputs — not independent measurements of demand.
- Can you get absolute search volume from Google Trends?
- Not directly — Trends is a relative 0-100 index. But because Trends measures exact strings, co-measuring it against known-volume anchor terms lets you scale the index to absolute figures per exact term. That is how calibrated estimates separate 'camera' (45,251/mo) from 'cameras' (9,316/mo) where Ads reports 165,000 for both.
- Why does Keyword Planner show no volume for some keywords?
- Policy filtering. Google restricts advertising around certain categories — crypto-related terms and children-related phrasings among them — and those keywords return no data even when Trends and Search Console show real demand. In our probes, 'child car seat' returned nothing while 'baby car seat' priced normally. The demand exists; the instrument declines to report it.